(Hypebot) Spotify stock closed down 4.14% on Thursday at $114.54, it’s lowest closing price ever. A down market may be accelerating the streamer’s decline, but as Chris Castle dove into Spotify’s stock woes, he saw its radical IPO strategy led to some of the company’s current complications and ensuing dip in stock price.
____________________________
Guest post by Chris Castle of Music Tech Solutions
Stocks go up, stocks go down, can’t pick a top and can’t pick a bottom.
However–Spotify is a particularly interesting stock for a number of reasons, mostly having to do with the nature of the initial offering. Remember, Spotify did not offer shares in an “initial public offering,” they used an untried method called a “direct public offering.”
The difference is crucial. In an IPO, or as its more precisely known, a “full commitment underwriting,” the company (or “issuer”) actually raises money through selling new shares of stock to a group of investors, usually banks. These investors are often called “underwriters”. In the case of a full commitment underwriting IPO, the company sells shares to an underwriting group (or “syndicate“) and the syndicate then sells those shares to the public after the syndicate decides the valuation of the company and the price of the shares of stock.
This is completely different from the direct public offering. There are no new shares, there is no syndicate, and the price is set (or was for Spotify) by reference to the price of shares selling in the private market immediately before the public is able to buy–and my bet is that the DPO price was a lot higher than an IPO price would have been. (Dropbox, for example, priced at $21 and closed at $28.48 on its first day of trading. Facebook priced at $38, Google at $85, Alibaba $68, Amazon was $18. Spotify priced at $132 using a loophole from the SEC. And what goes up, must come down.)
So, you may ask, if the issuer doesn’t sell shares to an underwriting syndicate, where do the shares come from?
The shares come from insiders at the company and any other shareholder, employee, record company, other investors already holding shares who want to get out. All of these insiders have an incentive to keep the share price as high as they can before they get their shares sold to the bigger fool…sorry, I mean to other investors.
If you look at the chart, you’ll see some interesting patterns developing. I don’t put a lot of trust in chart analysis, but some people do and it is one of the few things we have to rely on in this case because there is so much insider activity.
You’ll notice that there’s something of a “head and shoulders” pattern emerging when the stock reached its high on July 26, 2018 of $196.28. This pattern is often associated with a move to the downside, sometimes a sharp move to the downside.
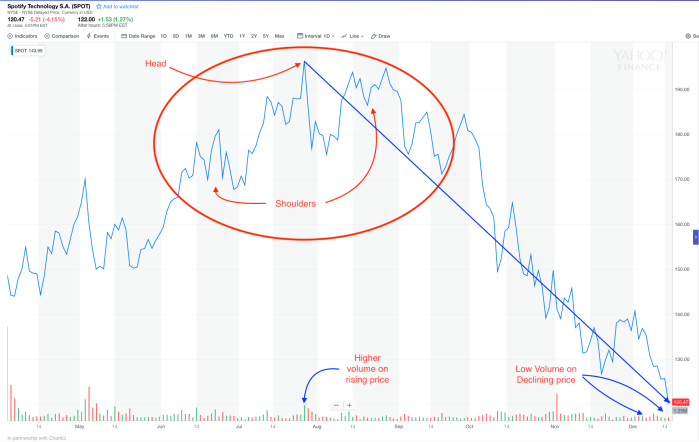
Sure enough, the stock went into a sputtering dive the next day and the dive has continued ever since. Note that at the high, volume was rising. The low volume of Spotify stock is another one of the untold stories and is another suggestion of price management in the background.
Once the downside move became apparent, which was about October 10, downward pressure accelerated on rising volume (relatively speaking since volume is low). A couple weeks later, more sell signals confirmed the downside move.
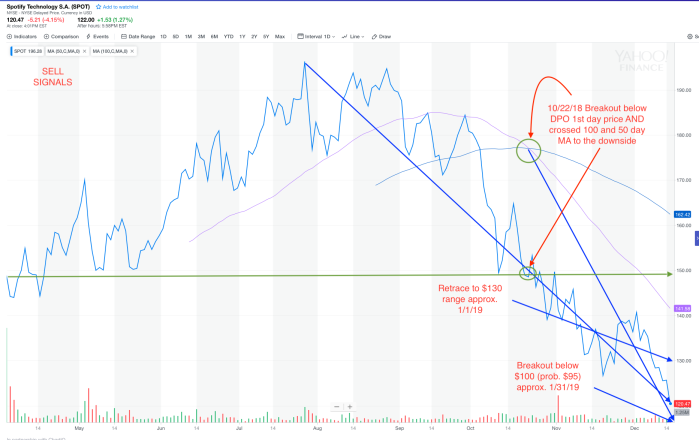
One signal that I found significant was the 50 and 100 day moving averages of the stock price crossed to the downside on October 22, which also happened to be the date that the stock closed below the closing price on the first day of trading.
Starting with the high at the head and shoulders formation, the stock has more or less collapsed on about a 45 degree downward angle ever since. Why is that? Possibly because the stock was priced too high to begin with. Some people think that SPOT is just reacting to the overall market sell-off. I don’t think that is true as SPOT has not moved in relation to the market since inception. SPOT was higher on the market highs and lower on the market lows, so I don’t see the coupling argument at all.
Plus, Spotify announced a $1 billion stock buy back, so the price is rapidly declining in spite of the buyback. Perhaps if Spotify had made a tender offer for shares at a fixed price, they could have supported the stock more successfully.
Based on the stock’s recent history, it would not be surprising to see SPOT retrace some of its collapse and rise to something in the $120-$130 range by the end of the year. Then I suspect that it will decline to approximately $95 around the end of January.
After that, we shall see. Obviously, this is not investment advice, just speculation based on some guesses derived from the chart. But the chart is relevant because there’s unlikely to be any real change in the company’s financial position in the next six weeks.
[Spotify stock closed down 4.14% on Thursday at $114.54, it’s lowest closing price ever.]